META
DATE: NOVEMBER 7, 2025
TAGS: DESKTOP, WORKFLOW, GAME DESIGN
ACKNOWLEDGMENTS: This tool was written in part by Gemini 3.0.
ABOUT
My PhD is about Game Balance - a term that's emergent, comes from a player's experience, and a bit different to everyone. As game designers, we release games out into the world and then have little insight into how they are played aside from game state data and telemetry. We have limited playtesting we can observe in person, and if we are using automated playtesting, there is no human to evaluate at all.
All that said, it begs the question - how do we evaluate the nuance, character, and drama of changes in game balance over the course of the game? How do we do it if we have thousands and thousands of sets of gameplay data? I needed to handle this specific task when working on my own AI balancing systems (see FighterDDA).
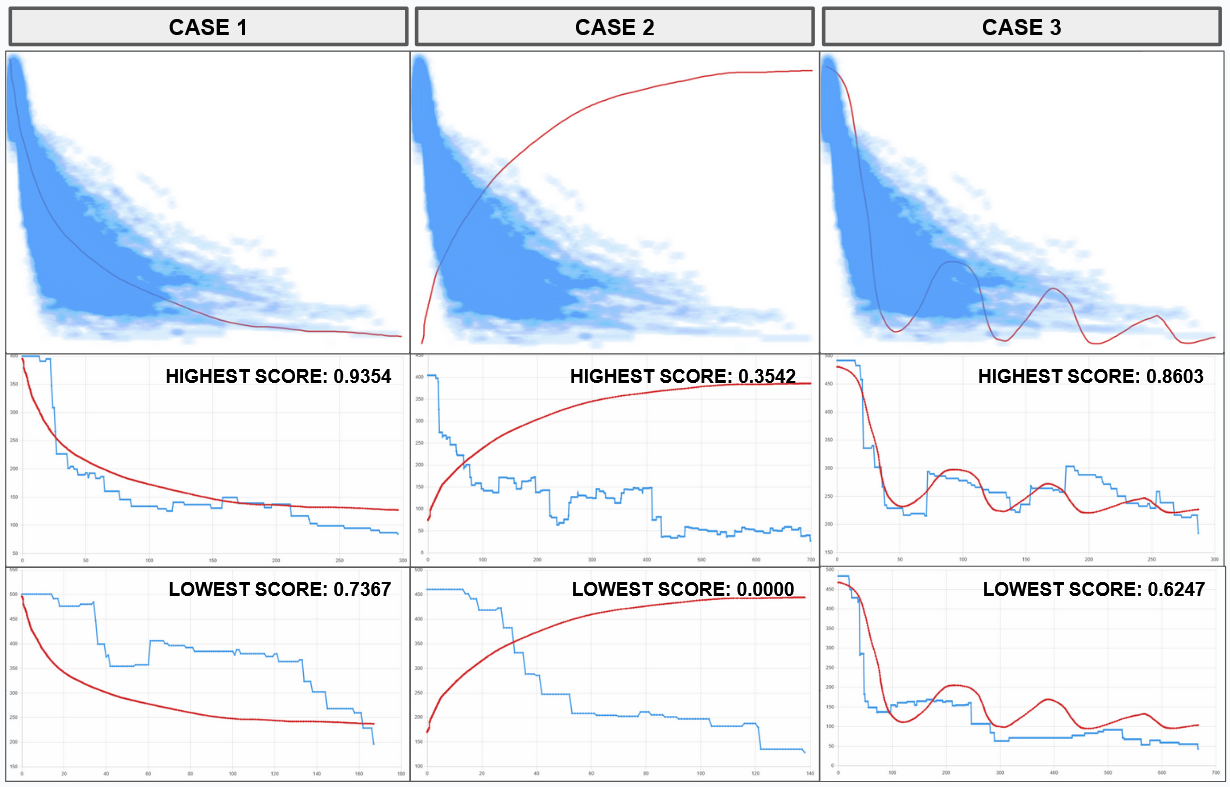
A core lesson I learned during my research is that balance is deeply linked to fairness, and the derivatives of fairness over gameplay tells a story about fairness waxes and wanes over time. We don't just want summed metrics, we want to see the push-and-pull of how fairness changes during gameplay. If I see 3000 play traces, do I see the types of drama I want? These questions motivated the development of PAS. It lets you not only see the global set of playtraces, but iterate through different dimensions of your data, and literally draw lines to find dramatic curves you want to see in gameplay.
TUTORIAL
Instructions for installation and usage are in the Github readme. That being said, the tool only really helps if you've collected a large corpus of playtrace data. This data should be saved in individual JSON files, with a progression metric and one or more y-axis values (hp, damage, actions, etc.) that you want to see the curvature of.